
In reverse osmosis (RO) system design, flux (water flux) is like a car’s speedometer — everyone watches it closely, so major mistakes are rare. But what truly gives field operators headaches are those seemingly insignificant hidden parameters that quietly affect system performance.
In wastewater reuse and zero-liquid discharge (ZLD) projects, many systems Commission perfectly during initial startup, only to suddenly experience a catastrophic drop in permeate output and a surge in differential pressure a few months later. When you open the pressure vessels, the membrane surface is either covered in rock-hard scale or a slimy biofilm, or the membrane sheets have become oxidized and brittle.
Beyond flux, let’s discuss the following easily overlooked key parameters — the true “invisible killers” that determine membrane life:
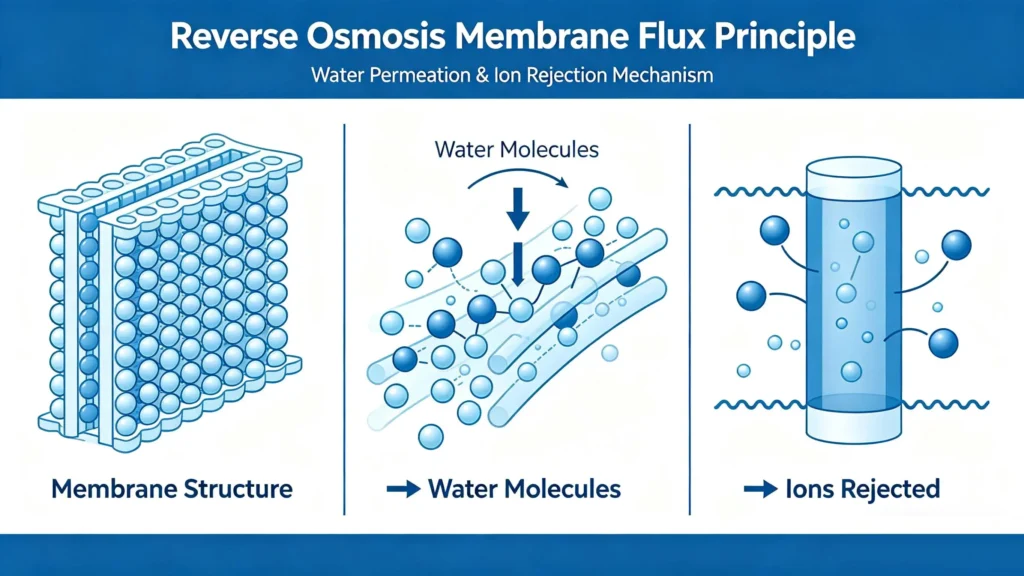
Recovery Rate and Concentrate Flow Rate
To meet customer demands for “high recovery,” many designers aggressively push the recovery rate. For example, they might forcibly raise the conventional brackish water recovery rate from 75% to 85% or even 90%.
Why? Recovery rate and concentrate flow rate are two sides of the same coin. The higher the recovery rate, the less concentrate is discharged, meaning scale-forming ions like calcium, magnesium, and silica become extremely concentrated on the membrane surface. Once supersaturation is exceeded, they crystallize and precipitate on the membrane surface. Silica scale is extremely hard and impossible to remove with standard acid cleaning — effectively declaring the membrane elements “disabled.”
Example: In a printed circuit board wastewater project with a designed recovery rate of 85%, the front-end membrane elements became completely sealed by calcium sulfate within just two months of operation. Not only did permeate output drop to zero, but the membranes themselves had a crystalline sheen when removed.
Solution: In wastewater applications, a higher recovery rate is not necessarily better. You must use the LSI (Langelier Saturation Index) and silica saturation as red lines. It’s better to discharge a bit more concentrate or use a two-stage RO system than to gamble with high recovery rates.
Feedwater SDI (Silt Density Index)
Many project design drawings clearly state an SDI limit of <3 or <5, but in actual operation, any minor fluctuation in upstream pretreatment (such as ultrafiltration or sand filtration) can cause the SDI to spike instantly.
Why? SDI measures how quickly colloids and fine particles in the water will clog a filter. For every 1-unit increase in SDI, the membrane fouling rate increases by 15%. These invisible colloids (such as iron/aluminum oxides and humic substances), once they attach to the RO membrane surface, form a dense cake layer, causing a sharp increase in differential pressure that is very difficult to clean off.
Example: In one project, to save costs, the replacement warning for 5-micron cartridge filters was disabled. A single damaged filter element allowed large amounts of sand and sediment to enter the RO system. Within one week, the inter-stage differential pressure rose from 0.2 MPa to 0.8 MPa, causing permanent fouling of all membrane elements.
Solution: Don’t just look at the design value — look at the assurance value. SDI instruments must be connected to real-time alarms, cartridge filter housings need sufficient redundancy, and filter elements must be replaced upon reaching their lifespan — never wait until “pressure drop limits are reached” before replacing.
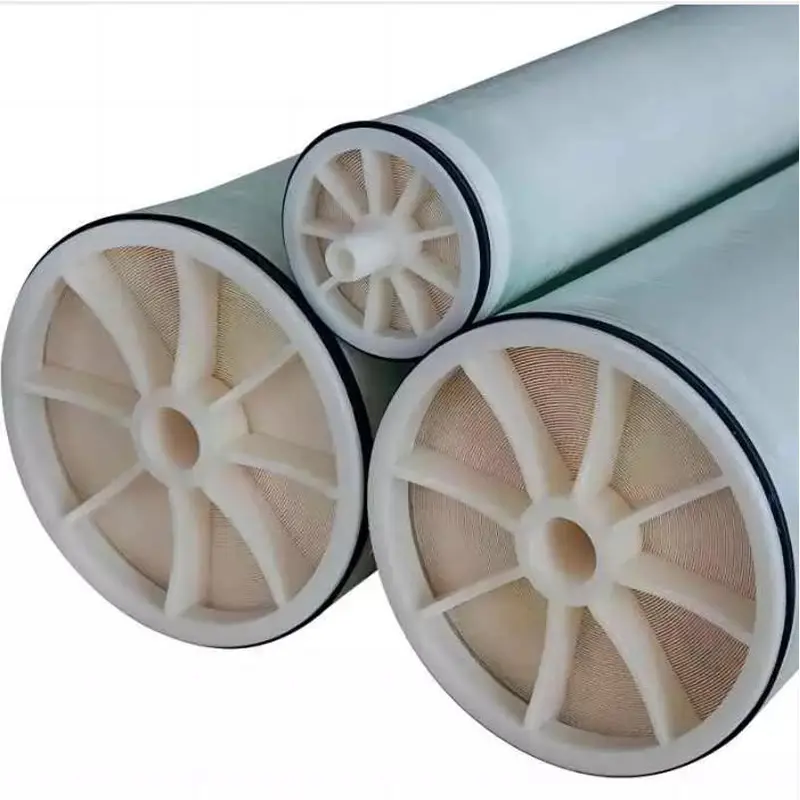
Oxidation-Reduction Potential (ORP)
In wastewater treatment, strong oxidants like sodium hypochlorite and ozone are often used upfront for disinfection or organic removal. This introduces a frequently overlooked parameter — feedwater ORP.
Why? Most modern anti-fouling RO membranes (e.g., polyamide-based) are extremely sensitive to oxidants. When the feedwater contains residual chlorine >0.1 ppm or ORP >200 mV, active chlorine attacks the polyamide rejection layer on the membrane surface, causing polymer chain scission. This damage is irreversible chemical etching, creating nanoscale holes in the membrane surface and causing a continuous decline in salt rejection.
Example: In a power plant project, an activated carbon filter that hadn’t been replaced for a long time allowed “chlorine breakthrough.” High concentrations of residual chlorine rushed into the RO system. After just one month, the RO membrane’s salt rejection plummeted from 99.5% to 92%, and no amount of cleaning could restore it.
Solution: An online ORP analyzer and residual chlorine monitor must be installed on the RO feed line. If levels exceed limits, automatically trigger an emergency shutdown, or ensure that the upstream reducing agent (e.g., sodium bisulfite) chemical dosing system is precise and reliable.
Operating Temperature
Temperature has a significant impact on RO permeate output (typically, a 1°C increase in temperature increases permeate output by about 3%). To achieve rated permeate output even in winter, some system designers quietly increase the high-pressure pump head or simply operate the membranes under overheating conditions.
Why? The safe operating upper limit for polyamide membranes is typically 45°C (113°F). If temperatures exceed 40°C (104°F) for long periods, the membrane’s polymer material undergoes thermal creep and physical aging, causing permanent deformation and enlarged pore size (irreversible loss of salt rejection). Even more concerning is internal leakage caused by thermal expansion and contraction — once the sealing O-rings at the ends of membrane elements fail, concentrate can directly mix with permeate.
Example: In a northern project, a heat exchanger was used to forcibly heat feedwater above 38°C (100°F) in winter to increase flux. After one year of operation, many membrane elements showed carbonized and cracked end seals, forcing a complete system shutdown and membrane replacement.
Solution: Temperature compensation design must include safety margins. If feedwater temperature fluctuates significantly, variable frequency pumps and automatic control valves are essential — never “squeeze out” permeate output through overpressure or overtemperature.
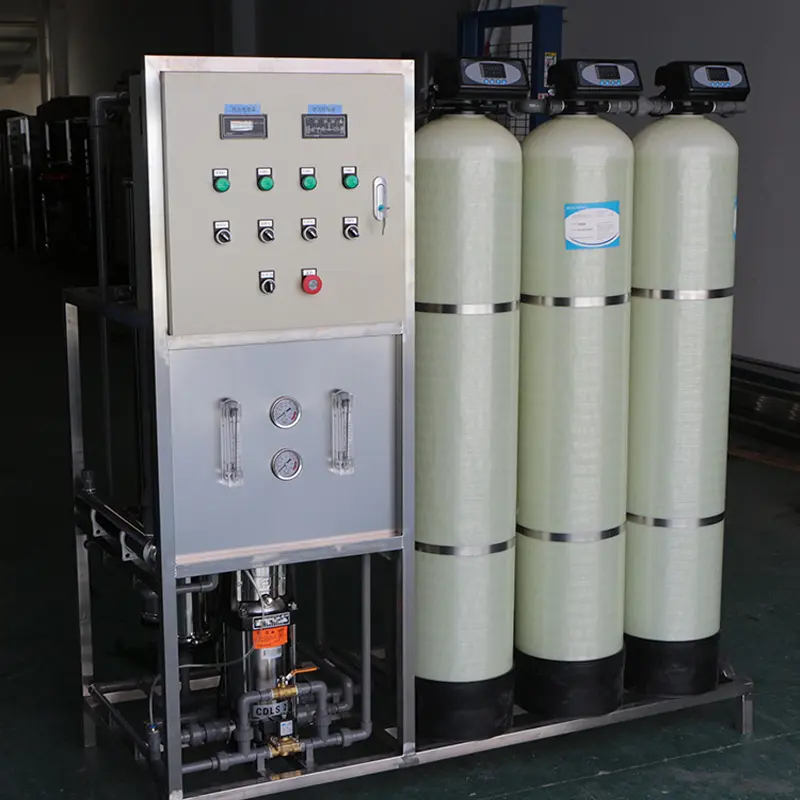
Concentrate Flow Velocity and Inter-Stage Differential Pressure
In multi-stage RO designs, as water passes through each stage, concentrate flow naturally decreases because water continuously permeates through the membrane. If flow distribution between stages isn’t carefully designed, the concentrate in the final stage often becomes nearly stagnant.
Why? A certain tangential flow velocity (on the concentrate side) is required to create turbulence that carries away accumulating salts and foulants (i.e., to mitigate concentration polarization). If concentrate flow is too low, the membrane surface velocity is insufficient, and foulants stick tightly to the membrane like sediment depositing in a riverbed. Additionally, if inter-stage differential pressure is too high, the internal membrane structure can be physically damaged due to excessive compaction.
Example: In a ZLD project using a two-stage design, the concentrate valve on the second stage was opened too little, resulting in extremely low flow velocity in the final stage. After three months, all 12 membrane elements in the final stage were completely sealed by a thick mixture of organic matter and colloids. During cleaning, even the cleaning solution couldn’t be pumped through.
Solution: Design must calculate concentrate flow rate and velocity for each stage. For scale-prone wastewater, consider partial concentrate recirculation or use inter-stage booster pumps to forcibly maintain adequate scouring flow velocity across the terminal membrane elements.
In summary
An RO membrane is like a highly precise “organ transplant surgery for water treatment.” flux is just the surface appearance — behind it, the water quality micro-environment (SDI, ORP), fluid dynamics (concentrate flow, differential pressure), and thermodynamics (temperature) are what truly determine its lifespan.
Truly excellent design is not about pushing parameters to their limits to reduce costs, but about leaving a safety margin for every potential risk point. After all, in the field of industrial water treatment, “not breaking down” is much more expensive than “being cheap” — but it’s also far more valuable.
Related Articles
- Characteristics of Reverse Osmosis Membrane Fouling and Reverse Osmosis Membrane Cleaning Methods
- RO Plant in Dialysis: A Detailed Guide to the Reverse Osmosis System
- RO Plant for Dialysis: A Detailed Guide to the Pretreatment System
- How to Design a Dialysis Water Distribution Loop When a 40-machine Center Opens with Only 10 Machines
- Vertical vs Horizontal RO Membranes: Does Installation Orientation Matter?
- Optimizing Circulating Cooling Water Systems Using Reverse Osmosis Membrane Filtration Permeate
- Control and Prevention of Silica Fouling on RO Membranes
- RO Membrane Antiscalant Dosing: From Calculation Principles to Practical Application
- RO System Design: Series Staging or Concentrate Recirculation for Small RO Systems?
- Winter Maintenance Tips for Water Vending Machines
- Small Reverse Osmosis Plant Process Details (0.5m3/Hour)
- NF Membrane VS RO Membrane VS Forward Osmosis Membrane
- How to Calculate Recovery Rate RO System?
- Relationship Between RO Membrane Element Pressure Limits and Recovery Rate in Water Reuse and Zero Liquid Discharge Applications
- How to Choose RO Membranes from China: 3 Key Factors to Consider